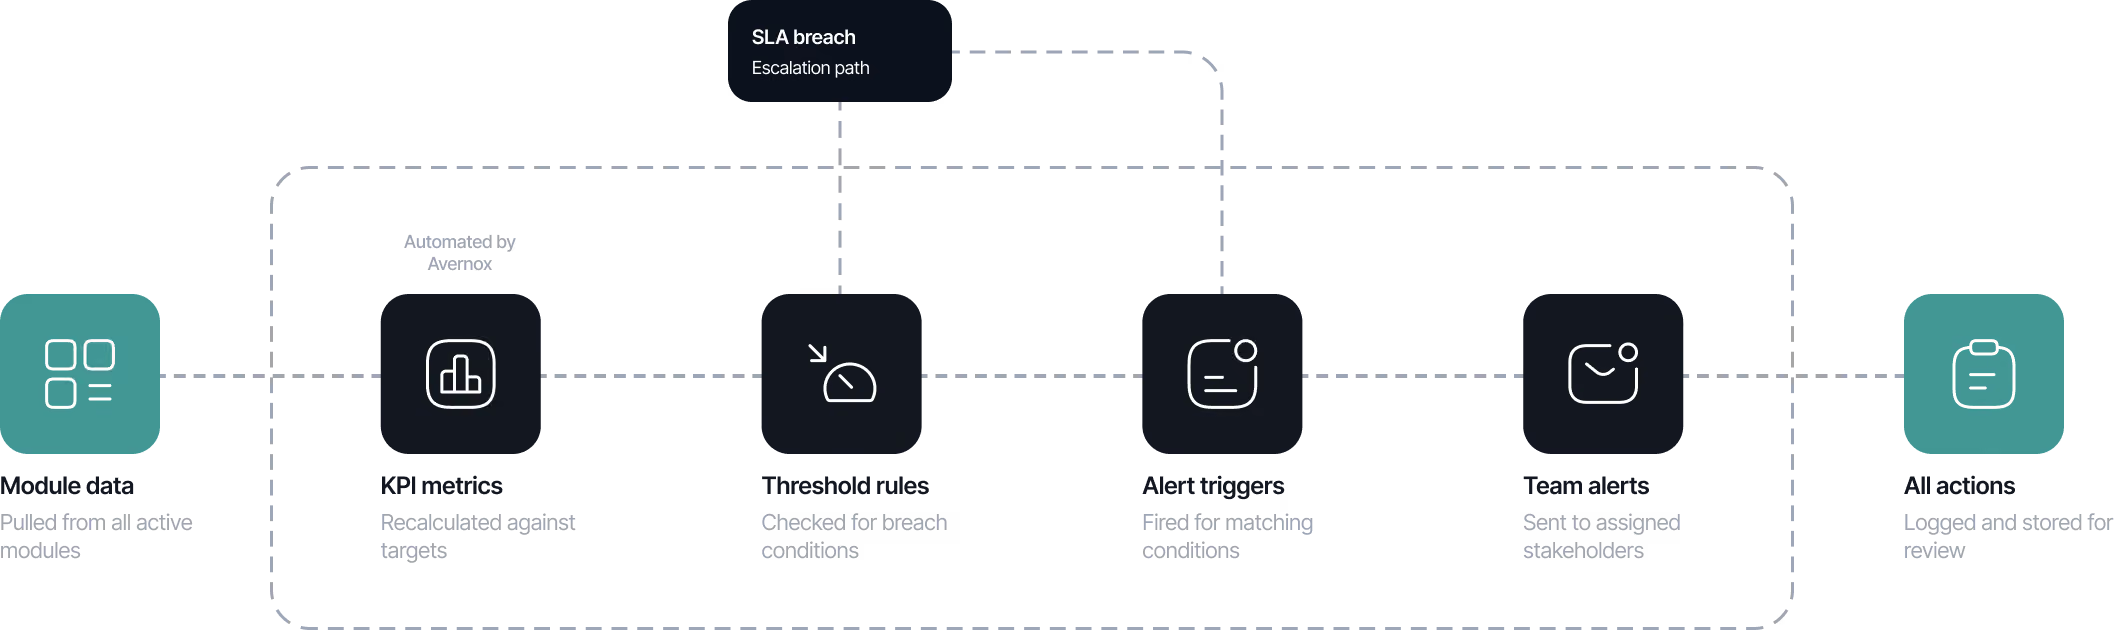

Teams check 4–6 dashboards daily, with no unified operational view

Reporting is delayed, manual, and wrong by the time it reaches decision-makers

No way to correlate events across returns, inventory, logistics, and customer ops
Blind spots are your most expensive ops problem
Most operations teams decide on yesterday's data, scattered across 4–6 dashboards. No cross-module view, no real-time signals.
One view. Every operational layer.
Dashboards
Configurable, role-based views for every team, built on live operational data.
Analytics
Surface patterns, quantify performance, and correlate events across every operational layer.
Operational Visibility
A live event feed across every module. Searchable, filterable, and auditable.
Everything your ops team needs
Dashboards
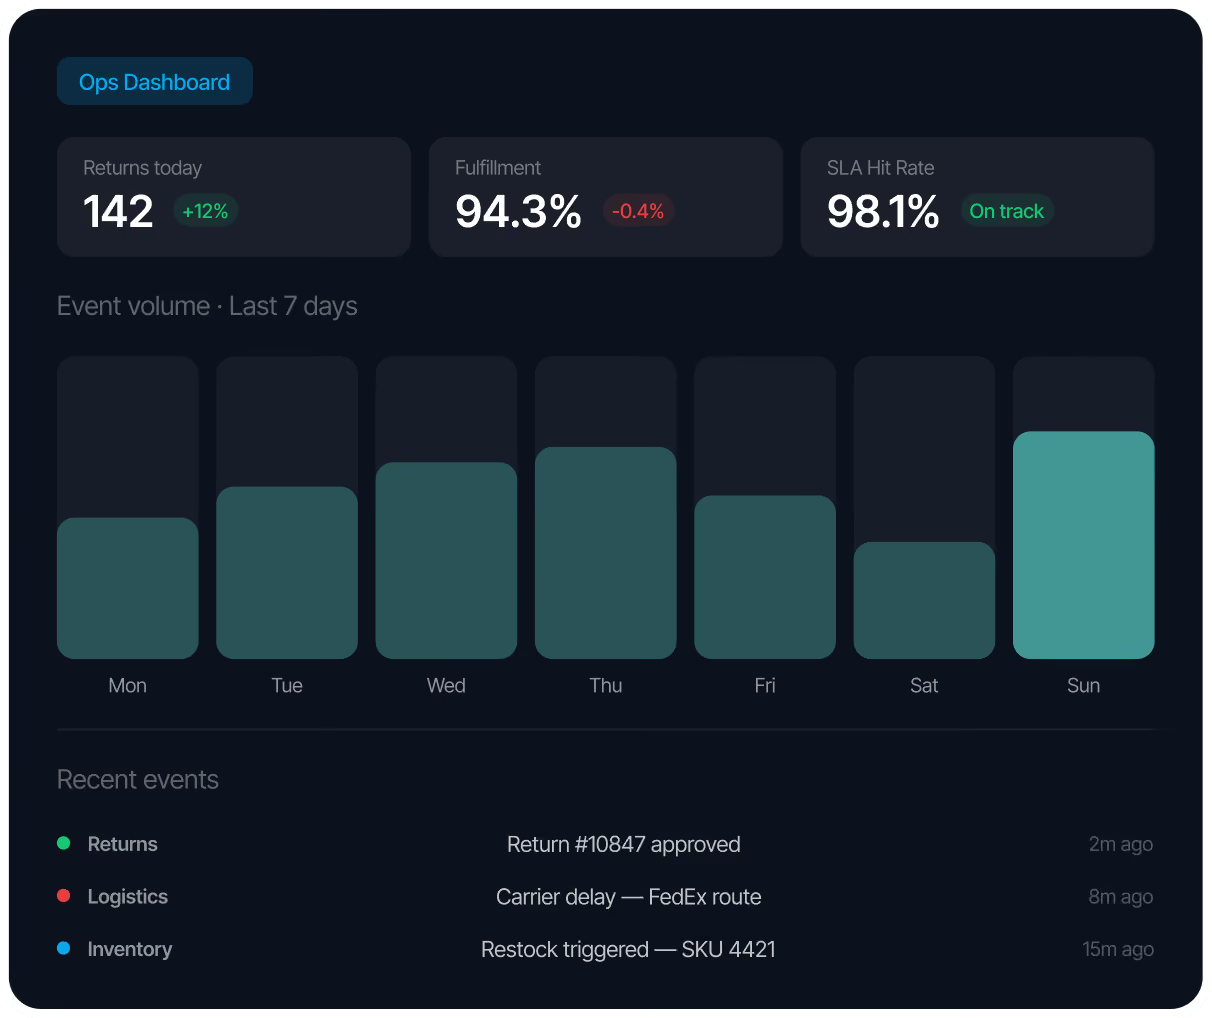
Role-based dashboards surfacing the KPIs each team needs in real time, with drill-down into event data.
Threshold alerts
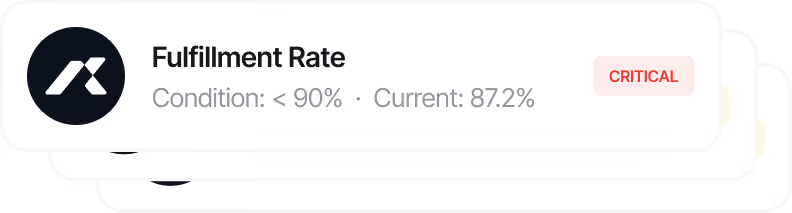
Set alert conditions by KPI, module, and threshold. Avernox notifies the right team the moment metrics go out of range.
Analytics
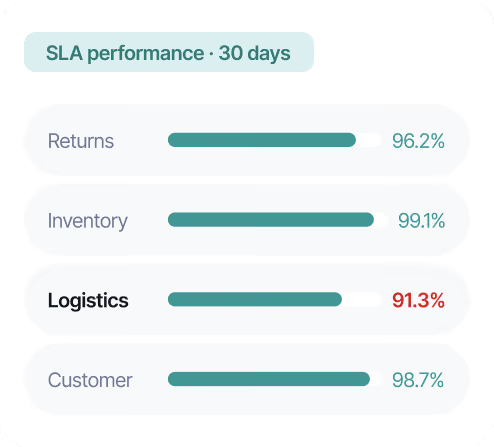
Correlate events, identify patterns, and quantify performance across returns, inventory, logistics, and customer ops.
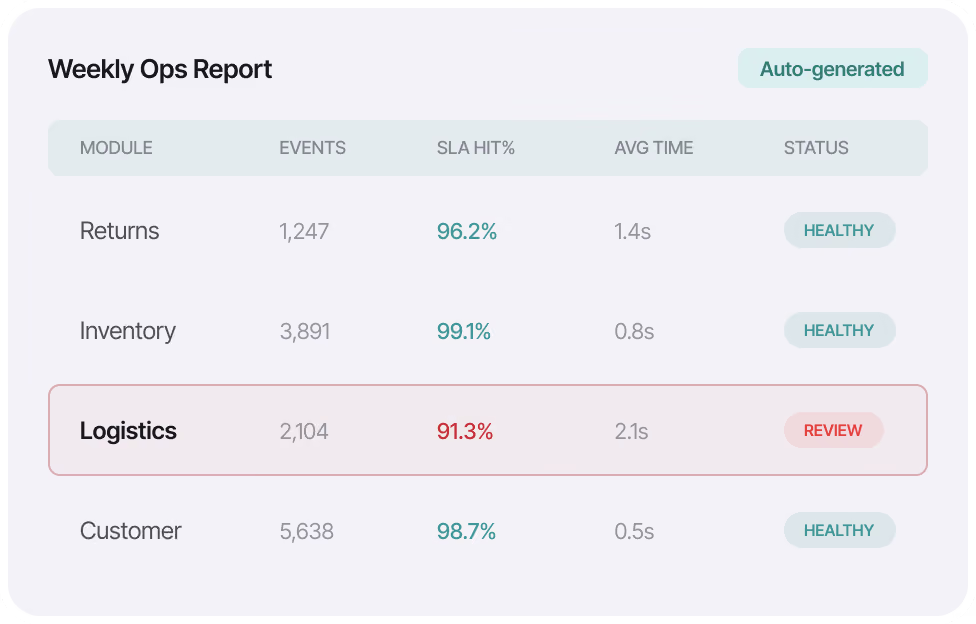
Performance reports
Scheduled and on-demand reports across every operational layer, no manual data extraction.
The full operational picture, in one place